KeyError: 'top' when plotting the predictions

Executing the following code gives me valid JSON:

print(model.predict("/content/IMG_6915_MOV-0020.jpg").json())

{"predictions": [{"inference_id": "2ae50773-258c-4f7a-b04d-b3de210bb0e3", "time": 0.06680524600000126, "image": {"width": 1080, "height": 1920}, "predictions": [{"x": 928.5, "y": 1037.0, "width": 189.0, "height": 414.0, "confidence": 0.8793137669563293, "class": "boxer", "class_id": 0, "detection_id": "e1061e9b-b432-4fc5-b801-d0392152c2f3", "keypoints": [{"x": 918.0, "y": 931.0, "confidence": 0.49679940938949585, "class_id": 0, "class_name": "c7-vertebra"}, {"x": 928.0, "y": 956.0, "confidence": 0.5031944513320923, "class_id": 1, "class_name": "right-shoulder"}, {"x": 902.0, "y": 940.0, "confidence": 0.47815075516700745, "class_id": 2, "class_name": "right-elbow"}, {"x": 940.0, "y": 926.0, "confidence": 0.48750701546669006, "class_id": 3, "class_name": "left-elbow"}, {"x": 928.0, "y": 929.0, "confidence": 0.5094068050384521, "class_id": 4, "class_name": "left-fist"}, {"x": 924.0, "y": 948.0, "confidence": 0.5222645998001099, "class_id": 5, "class_name": "sacrum"}, {"x": 899.0, "y": 944.0, "confidence": 0.47504496574401855, "class_id": 6, "class_name": "left-shoulder"}, {"x": 917.0, "y": 974.0, "confidence": 0.48197606205940247, "class_id": 7, "class_name": "left-hip-bone"}, {"x": 911.0, "y": 931.0, "confidence": 0.543993353843689, "class_id": 8, "class_name": "right-hip-bone"}, {"x": 915.0, "y": 971.0, "confidence": 0.4926051199436188, "class_id": 9, "class_name": "right-knee"}, {"x": 917.0, "y": 954.0, "confidence": 0.5371948480606079, "class_id": 10, "class_name": "right-heel"}, {"x": 915.0, "y": 941.0, "confidence": 0.478884220123291, "class_id": 11, "class_name": "right-sole"}, {"x": 912.0, "y": 982.0, "confidence": 0.48868149518966675, "class_id": 12, "class_name": "left-knee"}, ...}

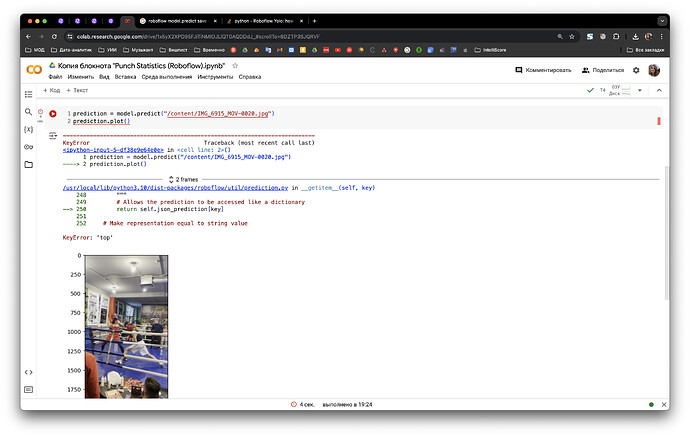
But when I try to plot the predictions via save() or plot(), it gives me a KeyError: ‘top’ and rejects to plot the coordinates.

The top key does not exist in the output data, but what should I do to add it?
Hey there fitwist,

Thanks for sharing the issue you’re encountering. Based on the screenshot, it looks like you’re using prediction.plot() directly after calling model.predict(image).

Just to clarify, is the error occurring specifically when you try to plot the predictions? If so, it might be related to the format of the bounding box coordinates in the JSON output.

The plot() function could be expecting the coordinates to be defined by top and left (representing the top-left corner of the bounding box). However, the JSON output from model.predict() likely provides x and y coordinates that represent the center of the bounding box, along with width and height.

To fix this, you can convert the center-based coordinates to the top-left corner format by calculating left and top like this:

for prediction in predictions:
    prediction['left'] = prediction['x'] - (prediction['width'] / 2)
    prediction['top'] = prediction['y'] - (prediction['height'] / 2)

# Now your predictions should be in the format expected by the plotting function.

Once you’ve made these adjustments, your plot() function should work without any errors.

I hope this helps! If you have any more questions or run into further issues, feel free to ask.

We’re all here to learn and support each other. Good luck with your project (удачи!).

Cheers,
Ray

Thanks a ton for a good explanation, I’ve finally plotted the predictions.

But it is definitely worth to mention, that for loop caused (TypeError: string indices must be integers), so the workaround loop looks like this:

for item in predictions['predictions']:
    for prediction in item['predictions']:
        prediction['left'] = prediction['x'] - (prediction['width'] / 2)
        prediction['top'] = prediction['y'] - (prediction['height'] / 2)

Next, executing predictions.plot() gives me an AttributeError: 'dict' object has no attribute 'plot',
so I decided to visualize it in matplotlib:

import matplotlib.pyplot as plt
import matplotlib.image as mpimg
import pandas as pd

image = mpimg.imread('/content/IMG_6915_MOV-0020.jpg')

fig, ax = plt.subplots()

for prediction in predictions['predictions']:
    for obj in prediction['predictions']:
        keypoints = obj['keypoints']
        for keypoint in keypoints:
            x = keypoint['x']
            y = keypoint['y']
            class_name = keypoint['class_name']
            ax.scatter(x, y, label=class_name, s=50)  # s - размер точки

ax.set_xlabel('X координаты')
ax.set_ylabel('Y координаты')


handles, labels = ax.get_legend_handles_labels()
by_label = dict(zip(labels, handles))

ax.imshow(image, extent=[0, image.shape[1], image.shape[0], 0])  # Установите границы осей

plt.show()

In this case things work almost like expected. The issue is resolved.

1 Like

Happy to hear you resolved the issue.

This topic was automatically closed 21 days after the last reply. New replies are no longer allowed.