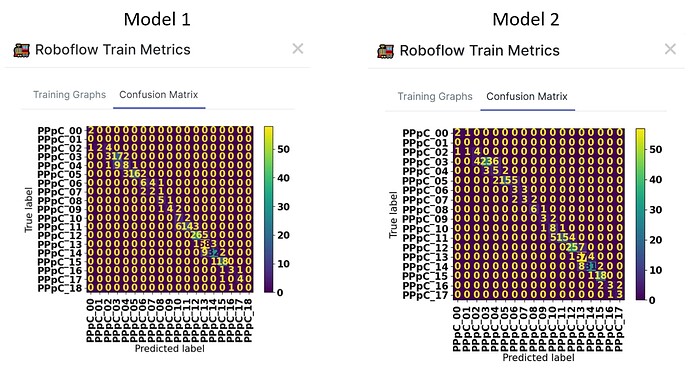
Project Type: Classification
Quick question about confusion matrices. I have created two versions of a dataset and trained models on them both – both use the same validation dataset. When I sum the columns in each matrix (i.e., Predicted label) I get the same number of images in both…however, when I sum across rows (i.e., True labels) the numbers vary.
For some reason this seems backwards to me. My intuition would be that the True labels don’t change between the two datasets…so row-sums should be the same. The Predicted labels can differ between the models, so I wouldn’t expect the column-sums to be the same…but they are.
Am I just not thinking about this correctly…or could the labels be swapped on the graph in RF?
One additional wrinkle to the example provided above. I noticed that when I calculate accuracy for each confusion matrix (i.e., diagonal entries divided by the total number of images) I get: Model 1 = 75.2% (224/298), Model 2 = 75.8% (226/298).
However, these results differ slightly from the accuracy reported for these models under the training results. The training results report the following values: Model 1 = 74.8%, Model 2 = 75.5%…what I noticed is that if I subtract 1 from the numbers reported in the confusion matrices I can get the results to reconcile [i.e., Model 1 74.8% ((224-1)/298), Model 2 75.5% ((226-1)/298]. Not sure why the training results accuracy calculations would be off by 1, but I wanted to mention it in case its useful. Thanks for any suggestions.
This is a fantastic write-up, and great insight into how we can improve the explainability of your results (insight into the metrics).
What I’m going to do is this: train a few example models, review the Confusion Matrices, and write up reports for our engineering team to see and look into.
I’ll also be sure to include your example in the results so we get to the bottom of this.
Thank you, again! @bssackma
